Welcome to our blog post on eye charts and their significant role in assessing visual acuity and maintaining optimal eye health. In this article, we will delve into the purpose and components of eye charts, their contribution to vision evaluation, and their importance in comprehensive eye examinations. We will also explore different types of eye charts, emphasize the significance of proper design, and provide essential tips for optimal eye care and chart usage.
At Medzell, a groundbreaking B2B platform promoting Indian medical devices in emerging markets, we acknowledge the importance of accurate vision assessment and eye health maintenance. Let’s now embark on a journey to uncover the secrets behind medical eye charts and their impact on visual acuity.
Understanding the Purpose and Components of Eye Charts
Eye charts play a vital role in vision testing by evaluating visual acuity, referring to the sharpness and clarity of an individual’s vision. They comprise specific components that aid in assessing a person’s visual capabilities. Understanding the purpose and components of eye charts is crucial for comprehending their significant role in eye examinations.
Eye charts primarily measure a person’s ability to discern letters, numbers, or symbols at a designated distance. The widely recognized Snellen chart, featuring rows of letters in descending sizes, is the most prevalent eye chart.
The components of an eye chart typically include
- Letters or symbols: Standardized letters or symbols, such as Snellen letters(capital letters) or Landolt C symbols(ring-shaped with a gap), ensure accurate evaluation of visual acuity.
- Size progression: Rows of letters or symbols on eye charts progressively decrease in size, enabling eye care professionals to determine the point at which vision clarity diminishes.
- Optotype distance: Eye charts are designed to be viewed at a specific distance, usually 20 feet (6 meters) for Snellen charts, ensuring consistent testing conditions and accurate assessment.
- Visual acuity measurement: Eye charts provide a visual acuity measurement, often expressed as a fraction, indicating what a person with normal vision can see at a designated distance, such as 20/20 vision.
By employing eye charts during vision testing, eye care professionals can evaluate visual acuity and identify potential vision issues. These charts are crucial for detecting astigmatism, visual impairments, and refractive errors like near sightedness or far sightedness.
How Eye Charts Help Assess Visual Acuity
Eye charts serve as a vital tool in evaluating visual acuity, determining the sharpness and clarity of a person’s eyesight. By presenting standardized letters, numbers, or symbols in various sizes, eye charts measure an individual’s ability to discern these details at a specific distance. Here’s how eye charts assist in assessing visual acuity:
- Determining the smallest readable text: Eye charts feature rows of letters or symbols that decrease in size as you move from top to bottom. By asking the individual to read the letters from a specific distance, eye care professionals can determine the smallest text size they can accurately identify. This provides a quantitative measure of their visual acuity.
- Comparing results to a standard: eye charts adhere to a standardized format, such as the Snellen chart. This enables eye care specialists to contrast a person’s visual acuity with what is considered to be “normal” or average vision. The results are expressed as a ratio, where the first number indicates the distance from which the chart is viewed and the second number indicates the distance at which someone with normal vision can read the same line.
- Detecting refractive errors: Finding refractive errors: Myopia, hyperopia, and astigmatism are a few examples of refractive irregularities that can affect visual acuity. When a person reads an eye chart, the presence of blurriness, difficulty in discerning certain letters, or the need to squint may indicate a refractive error. These observations help eye care professionals diagnose and prescribe appropriate corrective measures.
- Monitoring changes in visual acuity: Regular eye exams that involve reading an eye chart allow eye care professionals to monitor changes in visual acuity over time. By comparing previous and current test results, they can detect improvements or declines in vision and adjust treatment accordingly.
- Evaluating visual impairment: Eye charts assist in assessing the degree of visual impairment in individuals with vision loss. By determining the largest line or symbol they can read, eye care professionals can quantify the severity of impairment and tailor support or accommodations accordingly.
Overall, eye charts provide a standardized and quantitative method for assessing visual acuity. They serve as a baseline for comparing individual results to average vision capabilities, aiding in the diagnosis of refractive errors, and monitoring changes in vision over time. By using eye charts, eye care professionals can effectively evaluate visual acuity and provide appropriate recommendations or treatments for their patients.
Exploring Different Types of Eye Charts
Eye charts are available in various types, each designed to assess visual acuity and detect potential vision problems. Let’s take a closer look at some commonly used eye charts in vision testing
- Snellen Chart: The Snellen chart is widely recognized and features rows of uppercase letters in descending sizes. Each row represents a different level of visual acuity, and the person being tested reads the letters from a standard distance. Results are typically expressed as a fraction, such as 20/20, indicating normal vision.
- Tumbling E Chart: This chart is ideal for individuals who struggle with letter recognition, including children who cannot yet read. The letter “E” is shown in a variety of positions (up, down, left, or right), and the user chooses the direction the letter is facing.
- Landolt C Chart: Utilizing ring-shaped symbols with a gap, the Landolt C chart requires individuals to identify the position of the gap by pointing in the corresponding direction. It is useful for those who have difficulty recognizing letters or cannot provide verbal responses.
- LEA Symbols Chart: Specifically designed for young children or individuals with letter recognition challenges, the LEA Symbols chart employs symbols like apples, houses, circles, or squares in decreasing sizes. The person matches or identifies the symbols presented.
- Jaeger Chart: This chart focuses on near-vision or reading acuity. It contains paragraphs of text in various font sizes, typically assessed at a closer distance than the Snellen chart. Results are indicated by the smallest font size the person can comfortably read.
- LogMAR Chart: The LogMAR chart uses letters of equal legibility arranged in rows, with each row representing a different visual acuity level. It offers a precise measurement of visual acuity and is commonly used in research and clinical settings.
These are just a few examples of the diverse eye charts employed in vision testing. Each chart has unique features and applications, allowing eye care professionals to tailor assessments based on individual needs and abilities.
The Importance of Proper Eye Chart Design
Proper eye chart design plays a crucial role in accurate vision assessment and the effectiveness of visual acuity tests. The design of an eye chart involves several important considerations that impact its functionality and reliability. Here are key reasons highlighting the importance of proper eye chart design:
- Standardization and Consistency: Eye charts need to adhere to standardized guidelines to ensure consistency in vision testing. Standardization helps in comparing results across different testing sessions and locations, enabling accurate assessment of visual acuity and identification of changes in vision over time.
- Optimal Font and Letter Design: The choice of font and letter design is crucial in an eye chart. The letters should be carefully crafted to have consistent stroke thickness, appropriate spacing, and a clear, easily identifiable form. Well-designed letters minimize the risk of confusion and ensure accurate measurement of visual acuity.
- Contrast and Legibility: Eye charts should have high contrast between the letters and the background. This contrast ensures optimal legibility, allowing individuals to clearly distinguish the letters and accurately identify them. Proper contrast enhances the reliability and accuracy of visual acuity testing.
- Letter Size Gradation: Eye charts feature letters of varying sizes to assess visual acuity at different levels. The gradation of letter sizes should follow specific ratios to provide accurate measurements of visual acuity. A proper progression of letter sizes ensures that each line represents a distinct level of acuity, enabling precise assessment and easy interpretation of results.
- Testing Distance Consideration: Eye charts are designed for specific testing distances, such as the Snellen chart’s standard viewing distance of 20 feet (6 meters). The chart should be designed to be viewed accurately from the intended distance to ensure accurate measurement of visual acuity and reliable comparisons.
- Appropriate Line Spacing: Proper spacing between lines of letters on the eye chart is essential for avoiding visual interference. Sufficient spacing helps individuals focus on a specific line without distractions from neighboring letters or lines. It enhances the accuracy of results by minimizing errors caused by crowding or overlapping letters.
By ensuring proper eye chart design, eye care professionals can enhance the accuracy and reliability of visual acuity tests. Consistent standards, optimal letter design, contrast, legibility, appropriate letter size gradation, testing distance consideration, and suitable line spacing collectively contribute to precise measurement and interpretation of visual acuity. Properly designed eye charts enable accurate vision assessment and assist in diagnosing and monitoring various eye conditions and refractive errors.
Understanding Visual Acuity and its Measurement
A key criterion for determining how clear and precise one’s vision is is visual acuity. It measures the eye’s ability to perceive fine details and distinguish objects at a specific distance. Understanding visual acuity and its measurement is essential for evaluating and monitoring an individual’s overall vision health. Below are essential factors to take into account.
- Definition: Visual acuity refers to an individual’s ability to recognize letters or symbols of a specific size and distance. It provides a quantitative measure of vision compared to those with normal eyesight.
- Snellen Fraction: Visual acuity is typically represented as a fraction, such as 20/20. The denominator (also 20) represents the distance at which a person with normal vision can read the same line, while the numerator (for example, 20) represents the testing distance, which is frequently 20 feet.
- Visual Acuity Chart: Visual acuity is measured using charts like the Snellen chart. These charts consist of rows of letters or symbols, each corresponding to a different level of visual acuity. The smallest row accurately identified determines the person’s visual acuity.
- Testing Distance: Visual acuity is assessed at a standardized distance, usually 20 feet (6 meters) for the Snellen chart. In cases where the person cannot be positioned precisely, a correction factor is applied to compensate for the testing distance.
- Letter Size Gradation: Visual acuity charts feature letters or symbols of varying sizes, enabling precise measurement of visual acuity across different levels. As the person progresses to smaller letters, their visual acuity decreases.
- Interpretation of Results: Visual acuity results are interpreted based on the smallest line or letter that the person can accurately identify. For example, 20/40 vision means the person can read at 20 feet whereas someone with normal vision can read at 40 feet.
- Visual Acuity Categories: Visual acuity is categorized based on the level of impairment. 20/20 vision is typically regarded as normal, with visual impairments ranging from mild (20/30 to 20/60) to severe (20/200 or worse).
Comprehensive eye exams must include regular testing of visual acuity. With its assistance, it is simpler to identify refractive problems (such as nearsightedness and farsightedness) and other visual impairments that may call for corrective solutions like glasses or contact lenses. Consistent visual acuity tests play an indispensable role in monitoring changes in vision and detecting potential eye disorders or diseases. By understanding visual acuity and its measurement, individuals can take proactive steps to maintain their eye health and seek appropriate interventions when necessary.
Comprehensive Eye Examinations: What to Anticipate
During a comprehensive eye examination, you can anticipate a meticulous assessment of both your eye health and vision. Here’s what you can typically expect during the appointment:
- Medical History: Before starting any examinations, the eye care professional will speak with you about your medical history, including any eye-related issues, previous eye operations, drugs you’re presently taking, and any family history of eye illnesses. This information helps provide context for your examination and identify any potential risk factors.
- Visual Acuity Test: Your visual acuity test will reveal how sharp and clear your vision is. You will be asked to read letters or symbols on an eye chart to assess your ability to see clearly at various distances. This test aids in determining refractive defects such as astigmatism, farsightedness, and nearsightedness.
- Refraction Assessment: To determine your precise eyeglass or contact lens prescription, a refraction assessment is performed. You will look through a device called a phoropter and provide feedback on which lenses provide the sharpest and clearest vision.
- Eye Muscle Function: The eye care professional will assess your eye movements and coordination to ensure proper eye muscle function. Tests such as the cover test and eye tracking evaluation are conducted to detect conditions like strabismus (misalignment of the eyes) or amblyopia (lazy eye).
- Peripheral Vision Evaluation: Visual field tests assess your side or peripheral vision. You will be asked to focus on a central point and indicate when you see objects in your peripheral vision. This evaluation helps detect blind spots or peripheral vision loss, which may indicate conditions like glaucoma or retinal diseases.
- Pupil Response: Your pupils’ response to light will be examined using a penlight or specialized instrument. This test helps assess the functioning of the nerves and muscles controlling the pupils, providing information about neurological health and potential issues.
- Slit-Lamp Examination: During a slit-lamp examination, a biomicroscope is used to look at the cornea, iris, lens, and eyelids in the front of your eyes. This enables the eye care specialist to check for problems including cataracts, irregularities in the cornea, or infection symptoms.
- Measurement of Intraocular Pressure: High intraocular pressure is one of the key risk factors for developing glaucoma. Your eye care professional may measure the pressure inside your eyes using a tonometer. This test is typically painless and helps assess your risk for glaucoma.
- Retinal Examination: The back of your eye, including the retina, blood vessels, and optic nerve, will be examined. This can be done through dilating eye drops, which enlarge the pupils, allowing for a detailed view of the structures. Macular degeneration, diabetic retinopathy, and retinal detachment are a few disorders that can be found by retinal examination.
- Discussion and Recommendations: After the examination, the eye care professional will discuss the findings with you. They will explain any diagnosed conditions, address your concerns, and provide recommendations for treatment, if necessary. They may also discuss preventive measures, lifestyle changes, or the need for follow-up appointments.
It’s crucial to remember that the precise tests and assessments may change depending on the eye care professional’s experience and your unique needs.
The Role of Eye Tests in Assessing Eye Health
Eye tests play a crucial role in assessing eye health by evaluating various aspects of vision and detecting potential eye problems. Here are some key roles of eye tests in assessing eye health:
- Vision Assessment: Eye exams, including visual acuity tests, gauge how clear and precise one’s vision is. They aid in detecting refractive defects such as astigmatism, farsightedness, and nearsightedness. Assessing visual acuity is essential for determining the need for corrective measures such as glasses or contact lenses.
- Eye Muscle Function: Tests like the eye movement evaluation and cover test assess the coordination and alignment of the eye muscles. They help detect conditions like strabismus (misalignment of the eyes) or amblyopia (lazy eye). Proper eye muscle function is crucial for maintaining binocular vision and depth perception.
- Peripheral Vision Evaluation: Visual field tests assess the extent and quality of your peripheral vision. They can identify blind spots or loss of peripheral vision, which may be a sign of disorders of the retina or glaucoma. Assessing peripheral vision helps identify potential threats to visual awareness and safety.
- Intraocular Pressure Measurement: Elevated intraocular pressure is a primary risk factor for glaucoma. Eye tests, such as tonometry, measure the pressure inside the eye. Monitoring intraocular pressure helps identify individuals at risk for glaucoma and enables early intervention to prevent vision loss.
- Retinal Examination: The retina is in charge of gathering and sending visual data to the brain. Eye tests like dilated fundus examinations or retinal imaging allow eye care professionals to evaluate the health of the retina, blood vessels, and optic nerve. Conditions including macular degeneration, diabetic retinopathy, or retinal detachment can all be found using these tests.
- Assessment of Eye Structures: Eye tests, like slit-lamp examination or ophthalmoscopy, enable close examination of the front and back structures of the eye. They aid in locating anomalies in the iris, cornea, and other ocular components. These tests aid in the diagnosis and monitoring of conditions like cataracts, corneal disorders, or signs of inflammation or infection.
- Early Detection of Eye Diseases: Regular eye tests can detect eye diseases and conditions in their early stages, when they may not present noticeable symptoms. Early detection allows for timely intervention and treatment, potentially preventing or minimizing vision loss.
- Monitoring Eye Health: Regular eye tests are crucial for tracking and monitoring changes in eye health as time progresses. By comparing previous test results with current ones, eye care professionals can identify any deterioration or improvement in vision and take appropriate action if needed. Regular eye tests help in the ongoing management of eye conditions and maintaining optimal eye health.
Overall, eye tests are vital in assessing eye health by evaluating vision, eye muscle function, peripheral vision, intraocular pressure, and the health of eye structures. They enable early detection, intervention, and ongoing monitoring of eye conditions, contributing to maintaining good vision and overall eye health. It is recommended that you undergo regular comprehensive eye examinations as advised by your eye care professional.
Eye Charts from Leading Indian Manufacturers
DP-5007 Tumbling “E” Eye Chart
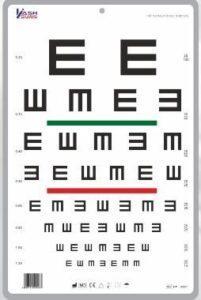
The DP-5007 Tumbling “E” Eye Chart, manufactured by Kashmir Surgical India Pvt. Ltd., is a renowned eye chart in India. It offers an exceptional alternative to traditional visual acuity tests due to its distinctive shape and effective grating features, enabling accurate assessment of visual acuity. They are particularly suitable for patients who are preliterate or illiterate. The chart includes red and green color bars, allowing for an easy and helpful color vision test. Made of durable PVC sheet with a matte texture, it is washable and non-reflective. The top center hole makes it convenient to hang on the wall. The DP-5007 Tumbling “E” Eye Chart is designed for measuring visual acuity at a distance of 3 meters or 10 feet.
ASF Snellen Chart 6 Meter With Frame
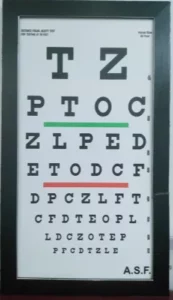
A.S.F. Universal, a reputable manufacturer and global supplier of eye charts in India, produces the ASF Snellen Chart 6 Meter With Frame, a high-quality vision testing tool. Snellen charts are widely used for visual acuity testing and are typically positioned at a distance of 6 meters. The symbols denoting “normal” acuity on the line subtend an angle of five minutes of arc at the standard distance, while the thickness of the lines and the spaces between the lines subtend an angle of one minute of arc. The ASF Snellen Chart 6 Meter With Frame ensures accurate and standardized visual acuity measurements
Aurochart
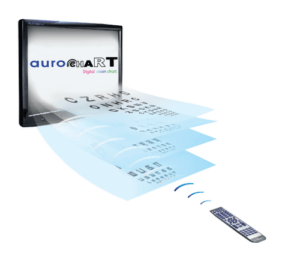
The Aurochart, manufactured and supplied by Aurolab in India, is a cutting-edge eye chart that offers comprehensive functionality. It is a handy remote control eye examiner chart incorporated in a 19-inch wide monitor with LED backlit, providing high resolution and contrast. The Aurochart includes charts for all aspects of an eye examination, with a special emphasis on the pediatric population. It features pre-fed high-resolution test images and is designed as an ETDRS chart. The Aurochart provides a simple optotype display of charts in a single row and is available in multiple languages, including English, and optional languages such as Tamil, Telugu, Malayalam, Kannada, Hindi, and Gujarati. It includes special charts for checking astigmatism, duo-chrome, Amsler’s grid, contrast sensitivity tests, color vision tests, Phoria tests, Aniseikonia tests, fixation targets, and power-saving modes. The Aurochart also offers built-in educational charts that explain the structure of the eye, refractive errors, and charts for occlusion conditions.
M20
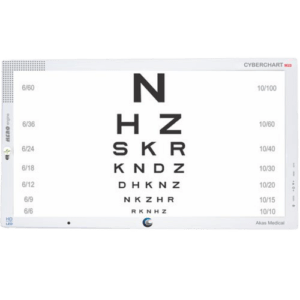 AKAS Technologies, an Indian manufacturer, has developed the M20, a maintenance-free device. This revolutionary cyber chart system outperforms traditional chart projectors and other visual acuity systems, offering a wide range of benefits. The M20 features extensive display modes for optotypes and a catchy remote control with direct commands for all tests. With no moving parts, it ensures a hassle-free user experience. The M20 provides a random display function for smart charts and allows for contrast sensitivity adjustment. It is adaptable to smaller rooms, thanks to its precise adjustment of the distance. The device also includes an external USB port for instant loading of personalized videos, photos, and charts. Additionally, the M20 boasts an exclusive image gallery for various eye diseases and HD surgery videos for patient education.
Conclusion
Eye charts are invaluable tools for assessing visual acuity and evaluating overall eye health. With their standardized format and precise measurement capabilities, they play a crucial role in detecting vision problems, recommending corrective measures, and facilitating comprehensive eye examinations. By understanding the purpose and components of eye charts, exploring different types, recognizing the importance of proper design, and utilizing them effectively, we can enhance our understanding of visual acuity and maintain optimal eye health. Remember to prioritize regular eye examinations and follow the recommended strategies for optimal eye care. Let’s embrace the power of eye charts to safeguard our precious gift of sight.
Medzell, a futuristic B2B platform for promoting Indian medical devices in emerging markets, provides innovative solutions in the field of eye care and aims to advance global eye health.